
WORCESTER, MA — A Worcester resident who repeatedly reported a missing street sign near their home said weeks passed without a clear answer about when it would be replaced. At one point, the resident said, the request appeared as closed in the City’s customer service system even though the sign was still gone.
That experience cuts directly to one of the central questions in a months-long What’s Up Worcester investigation into Worcester 311 and city service delivery: What does it actually mean when the City’s data says a service request is closed?
The answer, according to Worcester officials, is not as simple as it sounds.
What’s Up Worcester analyzed City of Worcester Customer Service Request System, or CSRS, records from 2024 and 2025 and compared geolocated requests with U.S. Census Bureau median household income data.
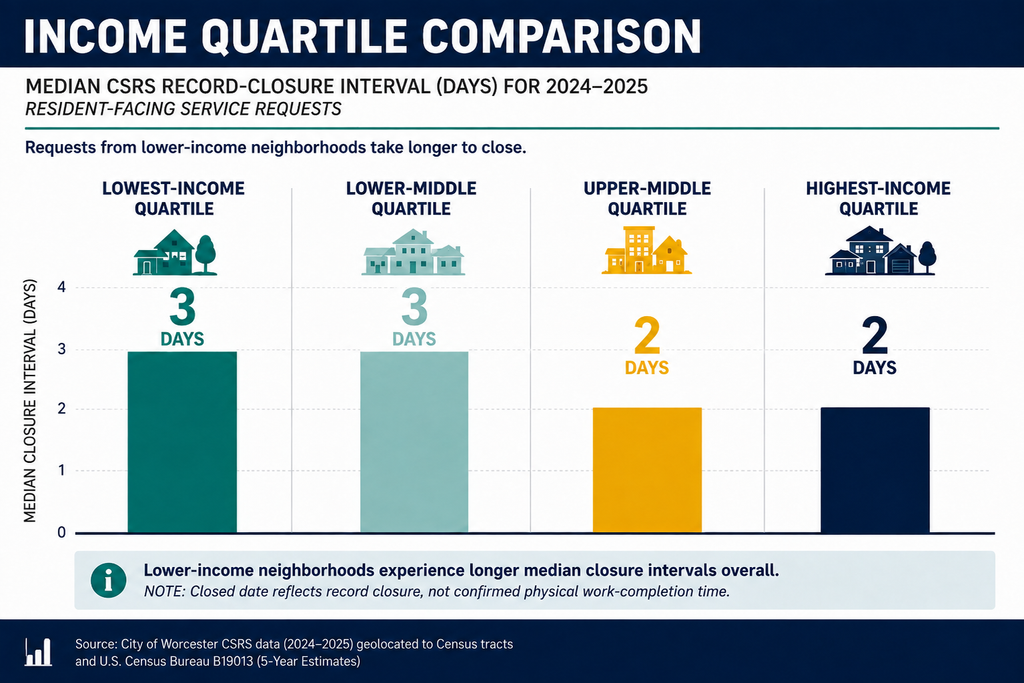
The analysis found that requests originating in the lowest-income quarter of Worcester census tracts had a median CSRS record-closure interval of three days, compared with two days in the highest-income quarter.
Some individual services showed much larger gaps.
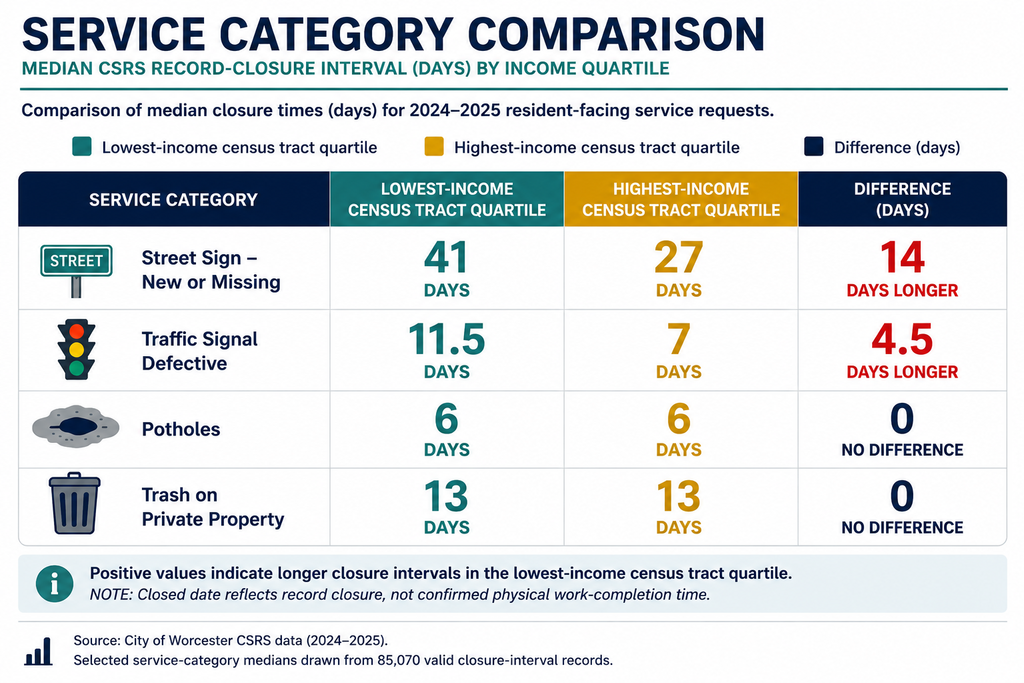
Requests categorized as Street Sign – New or Missing had a median closure interval of 41 days in the lowest-income quartile compared with 27 days in the highest-income quartile.
For Traffic Signal Defective, the median was 11.5 days in the lowest-income group compared with seven days in the highest.
But that pattern did not hold across every service.
Pothole records had a six-day median in both the lowest- and highest-income quartiles. Trash on Private Property requests had a 13-day median in both groups.
The results point to differences within Worcester’s 311 records, but they do not establish that lower-income neighborhoods consistently receive slower physical repairs.
The City says the public dataset cannot answer that question on its own.
More than 92,000 requests examined
What’s Up Worcester began with a City CSRS dataset downloaded Aug. 20 containing 367,310 records logged between Jan. 1, 2021, and July 6, 2026.
Using the coordinates supplied in the City data, 329,914 records could be assigned to one of Worcester’s 46 2020 Census tracts.
For the primary investigation, What’s Up Worcester narrowed the analysis to calendar years 2024 and 2025. The incomplete 2026 year was excluded from the main comparison, along with older records that could introduce different historical patterns.
The analysis focused on resident-facing requests submitted through channels including telephone, SeeClickFix, internet, email, walk-in, hotline, live chat, written complaints and the City Manager’s line.
Administrative appointments, internal task-force records, mark-outs, drop-off center transactions and other entries that did not appear to represent a resident reporting a neighborhood service condition were excluded.
That produced 92,306 eligible, geolocated resident-facing requests for 2024 and 2025.
Of those, 85,070 records had a valid, nonnegative interval between the date the request was logged and the CSRS Closed_Date.
Each geolocated request was matched with 2024 American Community Survey 5-Year median household income estimates using Census table B19013.
Two of Worcester’s 46 census tracts did not have usable median household income estimates, leaving 44 tracts for the income comparison.
Those tracts were divided into four groups based on median household income.
The median record-closure intervals were:
- Lowest-income quartile: 3 days
- Lower-middle quartile: 3 days
- Upper-middle quartile: 2 days
- Highest-income quartile: 2 days
The analysis also found a moderate negative association between tract median household income and tract median closure interval. A Spearman correlation test produced a coefficient of about -0.38 and a p-value of about 0.011.
That statistical association does not establish that household income caused requests to remain open longer. It shows only that, across the tracts studied, lower tract income was associated with longer median CSRS closure intervals.
And then came an important clarification from the City.
A closed request does not necessarily mean the work is done
After What’s Up Worcester provided the City with its methodology and initial findings, Tom Matthews, media and public relations administrator in City Manager Eric D. Batista’s office, said the Closed_Date field should not be treated as a consistent record of when the physical work requested by a resident was completed.
Matthews said Worcester 311 itself does not generally close work orders assigned to other operating departments. Once a request is submitted, it is routed to the appropriate department, which is responsible for investigating, updating and closing it.
A closure can mean several different things.
In some cases, the work was completed.
In others, a request may have been transferred to another department or division.
A work order can also be closed after being moved onto a list of work that will be handled later.
Matthews gave defective sidewalks as an example. A sidewalk complaint may be closed in CSRS after being added to the City’s sidewalk repair list, even though the actual repair will occur later.
That distinction changed how What’s Up Worcester describes the data.
This investigation does not call the measure a repair time or actual service-completion time.
It is a CSRS record-closure interval, calculated as the number of days between Date_Logged and Closed_Date.
That limitation matters.
A 41-day street-sign closure interval does not necessarily mean it took 41 days for workers to install a sign. A six-day pothole closure interval does not necessarily establish that the pothole itself was repaired six days after the resident reported it.
The public dataset, by itself, cannot consistently tell readers when the underlying physical work happened.
The City says more detailed records exist inside the system
Matthews said CSRS contains a separate log section or tab that records dates, times and notes associated with activity on a request.
Those records can provide more detail about what happened after a request entered the system.
They are not represented as a consistent first-action field in the public dataset used for this analysis.
That means anyone trying to compare actual service response across thousands of public records faces a basic limitation: the publicly available closure date is easy to calculate, but according to the City, it does not consistently measure the thing residents may assume it measures.
For residents, the distinction can be more than technical.
The anonymous Worcester resident interviewed for this investigation said they reported a missing street sign more than once and later saw the request appear closed even though the sign remained missing.
Their experience does not prove a citywide pattern. It does, however, illustrate exactly the type of disconnect the City says can occur between a CSRS closure and physical completion.
Worcester does not analyze 311 performance by neighborhood income
What’s Up Worcester also asked the City whether it analyzes 311 or service-request performance by neighborhood, Census tract, district, income level or another geographic measure to identify possible disparities.
The City’s answer was: No.
That leaves a significant accountability question.
Worcester collects hundreds of thousands of service-request records and uses the system to route resident complaints across departments. But the City says it is not currently analyzing those outcomes geographically to determine whether requests from one area of Worcester move differently through the system than requests from another.
The distinction is important because Worcester is not one uniform place.
A pothole on one street may require a straightforward repair. Another may involve utility work, traffic concerns or a larger road project.
The same is true for streetlights, sidewalks, traffic signals, sanitation and other complaints.
Without comparing similar service categories and accounting for those operational differences, a citywide average can hide more than it reveals.
Different services follow different processes
City officials said there are numerous reasons one work order may remain open longer than another, including staffing levels, workload, request volume, weather, the complexity of the problem, coordination among departments and, in some cases, coordination with outside utility companies.
Streetlights are one example.
Matthews said some streetlight repairs may involve underground wiring and work by National Grid rather than solely by City employees.
Some service categories also have their own response expectations.
The City said potholes are expected to be filled within 72 business hours under city ordinance.
Traffic-signal complaints are reported immediately to the appropriate traffic division.
Housing complaints involving no heat, hot water or electricity are treated as emergencies and immediately assigned to an inspector.
Missed sanitation complaints are generally collected the same day or the next business day, according to the City.
Those differences are one reason What’s Up Worcester looked not only at the overall income-quartile comparison but also at individual service categories.
And those category-level results were mixed.
Street signs and traffic signals showed larger gaps
Of the services reviewed, Street Sign – New or Missing stood out.
The median closure interval was 41 days among records originating in the lowest-income tract group and 27 days among those in the highest-income group.
Defective traffic signals showed another measurable difference: 11.5 days compared with seven days.
But potholes, one of the most common and visible neighborhood complaints, showed no median difference between the lowest- and highest-income groups. Both were six days.
Trash on Private Property also showed no median difference, at 13 days in each group.
The data therefore does not support a simple conclusion that lower-income areas wait longer for everything.
Instead, it raises questions about why certain categories appear different and whether those differences remain once the underlying work process is examined more closely.
Residents describe different experiences
The four residents selected for this investigation did not describe one uniform Worcester 311 experience.
One resident, who requested anonymity, said they reported a missing street sign near their home more than once. According to the resident, weeks passed without a clear timeline for replacement, and the request later appeared closed even though the sign was still missing.
Ava Taylor described a different frustration: not necessarily just how long a request takes, but how little visibility residents may have after submitting it.
Taylor said repeated follow-up can leave residents unsure about what action has been taken, where a request stands or whether the problem has actually been resolved.
Marcus Rivera, a Burncoat resident, described a more positive experience.
Rivera said the City has generally responded to problems he has reported without requiring a large amount of follow-up. Some requests take longer than others, he said, but he generally receives an update or sees the issue addressed.
Danielle Ortiz, a Vernon Hill resident, also reported a positive experience.
Ortiz said she contacted the City about a pothole near her home and saw it repaired within a few days without needing to submit another request.
Their experiences do not prove that one neighborhood receives better or worse treatment than another.
They do show why resident experience cannot be reduced to a single number.
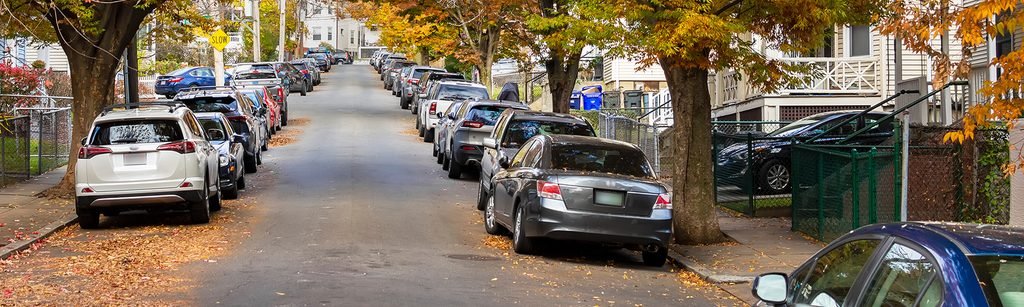
Someone may receive a quick pothole repair in an area that is generally considered lower-income. Another resident may see a street-sign request closed before the sign is replaced. A third may get consistent updates even when the work takes longer.
That complexity is also visible in the data.

District 5 councilor says he has not observed a neighborhood divide
District 5 City Councilor Jose A. Rivera said his office regularly hears from residents about municipal-service concerns, sometimes before a 311 request is submitted and sometimes after residents have already used the system.
His office works with the City Administration to follow up on constituent issues.
Rivera said that, based on his experience representing District 5 and handling constituent-service matters during his time on the City Council, he has not observed a meaningful difference in municipal service delivery based on the neighborhood or part of Worcester where a request originates.
He pointed instead to differences among the requests themselves, including their complexity, available resources, inspections and other operational considerations.
Rivera said he believes the City Administration is committed to providing services equitably across Worcester.
He also noted that City Council members can request additional information from the Administration, including through formal council orders, when questions arise about municipal operations.
His perspective provides an important counterpoint to the numerical pattern.
The analysis found an overall income-related difference in CSRS closure intervals, but Rivera said that difference has not been apparent to him through constituent-service work.
Both can be true: an aggregate data pattern can exist without being obvious in day-to-day constituent cases, particularly when the underlying service categories and reasons for closure differ.
Worcester has already begun reviewing old open work orders differently
The City said it has made at least one operational change since the years covered by this investigation.
Beginning in April 2026, Worcester 311 started providing departments with quarterly reports identifying all open work orders for review.
Departments are asked to review the records, update notes when appropriate and close work orders when the requested work has been completed.
According to Matthews, the process has helped identify cases in which work may already have been completed but the record was never formally closed, along with requests that lacked sufficient notes or status updates.
That change reinforces another limitation of historical CSRS data: not every long interval necessarily represents a resident waiting that entire period for physical work.
Some may reflect records that remained administratively open after work was finished.
Others may show the opposite: records that were closed before the physical work occurred.
Worcester’s 311 system has drawn previous scrutiny
This is not the first attempt to understand what Worcester’s service-request data can tell residents.
The Worcester Regional Research Bureau published an interactive project in May 2025 titled Where are Worcester’s Woes?, mapping Worcester 311 and other customer-service requests.
The Research Bureau described the service system as one of the most regular ways many residents interact directly with local government and noted that the response residents receive can shape how they view the City and their elected representatives.
Paul Matthews, executive director and CEO of the Research Bureau, shared that report with What’s Up Worcester after being contacted for this investigation. He was unavailable for a substantive interview before publication.
The Bureau’s work focused heavily on where requests originate.
This investigation asks a related but different question: after requests enter the system, do the records move differently depending on the economic characteristics of the places they come from?
The answer, based on the available data, is complicated.
National research offers a warning against simple conclusions
Research in other cities shows why raw differences in 311 outcomes should be interpreted carefully.
A 2024 study by political scientists Brian T. Hamel and Derek E. Holliday examined approximately 42 million 311 requests across 13 large U.S. cities between 2011 and 2019.
They found that wealthier and whiter neighborhoods received faster responses overall.
But when the researchers compared the same types of service requests, they found no evidence that cities systematically responded faster to requests from whiter and more affluent neighborhoods than to equivalent requests from less white and less affluent areas.
The researchers said part of the overall disparity appeared to come from differences in the types of services neighborhoods requested, with poorer and less-white neighborhoods more often requesting services that required more time or resources to address.
That finding is particularly relevant to Worcester.
The overall Worcester analysis showed a one-day difference between the lowest- and highest-income tract groups, but the service-by-service results varied substantially.
A separate study examining 311 systems in 15 U.S. cities similarly found that cities were generally not systematically biased in how they responded to service requests, although results differed among individual cities.
Other research has found evidence of inequity in specific kinds of municipal infrastructure.
Justin de Benedictis-Kessner of Harvard Kennedy School studied sidewalk conditions and 311 participation and found that sidewalks in less wealthy and more heavily minority areas improved more slowly on average than those in wealthier and whiter areas.
His research also found that resident participation through 311 could help narrow some of those gaps: when residents in lower-income and minority areas used 311 to request repairs, their sidewalks improved at rates more comparable with other neighborhoods.
Together, those studies point toward the same caution raised by Worcester’s data.
An overall neighborhood disparity can exist without proving that City employees are deliberately treating residents differently.
The type of complaint, underlying infrastructure, resident participation, administrative procedures and the resources required to complete different kinds of work can all shape the numbers.
What the Worcester data actually establishes
The strongest conclusion supported by this investigation is narrower than the one What’s Up Worcester initially set out to test.
During 2024 and 2025, resident-facing CSRS records originating in Worcester’s lowest-income census tracts had longer median administrative closure intervals than records from the highest-income tracts.
That association was statistically measurable at the tract level.
Some service categories, including new or missing street signs and defective traffic signals, showed larger differences between the lowest- and highest-income areas.
Others, including potholes and trash on private property, showed no median difference.
The available data does not establish that Worcester physically completes city work more slowly in lower-income neighborhoods.
It does not establish intentional discrimination.
It does not establish that income caused the differences.
And because the City says Closed_Date can represent different stages of a request depending on the department and service involved, the public dataset cannot consistently tell residents exactly how long a reported physical problem took to resolve.
That limitation itself is significant.
A transparency question beyond three days versus two
The investigation began with a straightforward question: Do lower-income Worcester neighborhoods receive slower municipal services?
The public CSRS records do not provide a clean yes-or-no answer.
They show differences worth examining, including an overall three-day versus two-day median closure interval and larger gaps in some individual categories.
But they also show categories with no gap.
Resident experiences are mixed.
A district councilor says he has not observed a meaningful geographic difference through his constituent work.
National research shows that apparent neighborhood disparities can shrink or disappear once similar types of requests are compared.
And the City itself says the field most easily available for large-scale public analysis does not consistently mean the requested work has actually been completed.
That leads to another question.
If Worcester does not currently analyze service-request outcomes by neighborhood, Census tract or income, and if the public closure date does not consistently represent physical completion, then neither residents nor outside researchers have a simple way to evaluate whether actual municipal service delivery is equitable across the city.
The City does have more detailed activity logs within CSRS, according to officials.
Whether that information can be made available in a form that allows systematic neighborhood-level analysis remains an important question beyond this investigation.
For a resident waiting for a street sign, pothole repair or another neighborhood problem to be addressed, the difference between a record being closed and the work actually being finished is not academic.
It is the difference between what the system says happened and what they can see outside their door.
How What’s Up Worcester Analyzed the Data
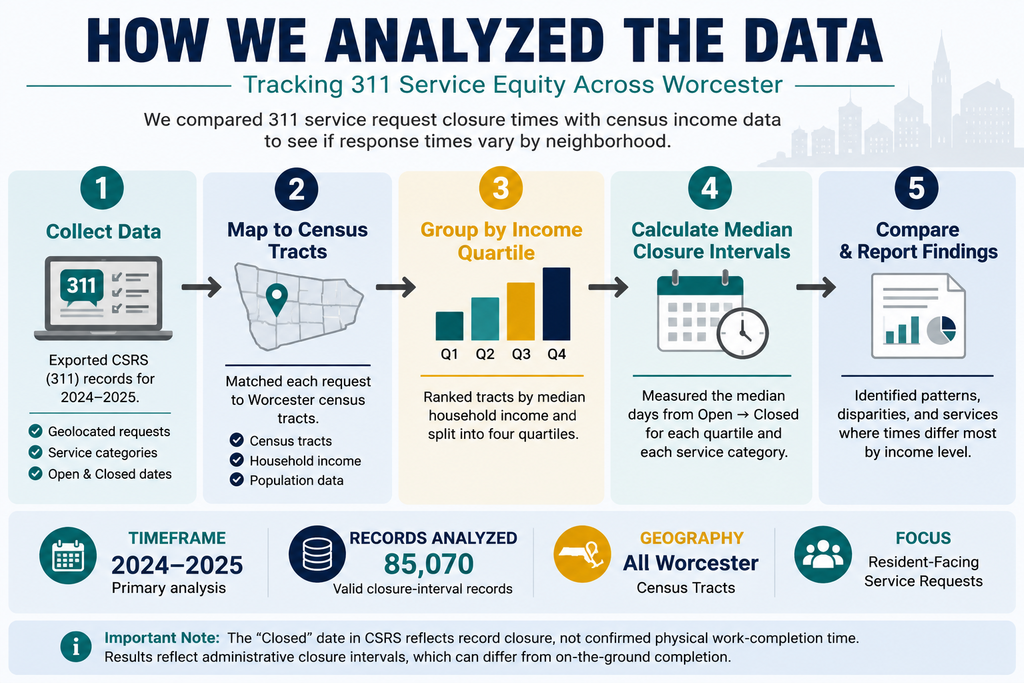
What’s Up Worcester used the City of Worcester’s Customer Service Request System dataset downloaded Aug. 20, 2026.
The raw dataset contained 367,310 records covering Jan. 1, 2021, through July 6, 2026.
Using the X/Y geographic coordinates contained in the City data, 329,914 records were assigned to Worcester’s 46 2020 Census tracts.
The primary analysis was limited to requests logged during 2024 and 2025.
The investigation excluded the incomplete 2026 year from the primary comparison and did not use the older years as part of the principal income-quartile analysis.
Resident-facing requests submitted through phone, SeeClickFix, internet, email, walk-in, hotline, live chat, written complaints and the City Manager’s line were included.
Administrative appointments, internal task-force entries, mark-outs, drop-off center transactions and other records that did not appear to represent resident reports of neighborhood service conditions were excluded.
That left 92,306 eligible geolocated resident-facing requests.
Of those, 85,070 had a valid, nonnegative interval between Date_Logged and Closed_Date.
Requests were matched to 2024 American Community Survey 5-Year Estimates, Census table B19013, for median household income.
Forty-four of Worcester’s 46 Census tracts had usable median household income estimates and were divided into four income quartiles.
Closure intervals were calculated as:
Closed_Date - Date_Logged
After receiving clarification from the City, What’s Up Worcester describes that calculation as a CSRS record-closure interval, not a physical repair time or service-completion time.
The City says Closed_Date may indicate completion, transfer to another department or movement of the request onto a future work list.
What’s Up Worcester used medians because extremely long or unusual cases can heavily distort averages.
The analysis also tested the relationship between tract median household income and tract median CSRS closure interval using a Spearman correlation. The result was approximately -0.38, with a p-value of approximately 0.011.
That result is reported only as an association. It does not establish causation.
Fund for Investigative Journalism Disclosure
This investigation was supported by the Fund for Investigative Journalism.
🔎 W.U.W. Verification Box
• Project / Topic: Neighborhood Divide: Who Gets What in Worcester’s City Services, an investigation into Worcester 311 and CSRS service-request records across census tracts with different median household incomes.
• Current Status: What’s Up Worcester completed its primary 2024–2025 CSRS and Census income analysis, interviewed residents, obtained responses from the City of Worcester and a district city councilor, and reviewed relevant published research on 311 service delivery.
• Key Dates or Decisions: The primary analysis covers requests logged from Jan. 1, 2024, through Dec. 31, 2025. The City dataset used for the investigation was downloaded Aug. 20, 2026.
• Estimated Cost: This reporting project was supported by a $9,800 grant from the Fund for Investigative Journalism.
• Timeline: The raw City dataset covers Jan. 1, 2021, through July 6, 2026. What’s Up Worcester used 2024 and 2025 for its primary comparison to avoid treating the incomplete 2026 year as a full year.
• Immediate Next Steps: What’s Up Worcester plans to hold a public forum on the findings, publish a follow-up resident survey and continue examining whether more detailed CSRS activity records can provide a clearer measure of the time between a resident report and actual City action.
• Primary Sources: City of Worcester CSRS records; 2020 Census tract geography; 2024 American Community Survey 5-Year Estimates, table B19013; City of Worcester response through Tom Matthews; District 5 Councilor Jose A. Rivera; four Worcester resident interviews; Worcester Regional Research Bureau 311 research; and published academic studies examining equity and 311 service delivery.
• What We Do Not Yet Know: The public CSRS dataset does not consistently identify when the physical work requested by a resident was completed. The City says more detailed dated activity logs exist within CSRS, but the dataset analyzed for this story does not provide a uniform public first-action or physical-completion timestamp across all requests.

About The Author